

Reporting & Analytics
Stay in control: Analyze your revenue, processes, and performance—all within a single system.
Analyze Your Revenue and Identify Valuable Trends
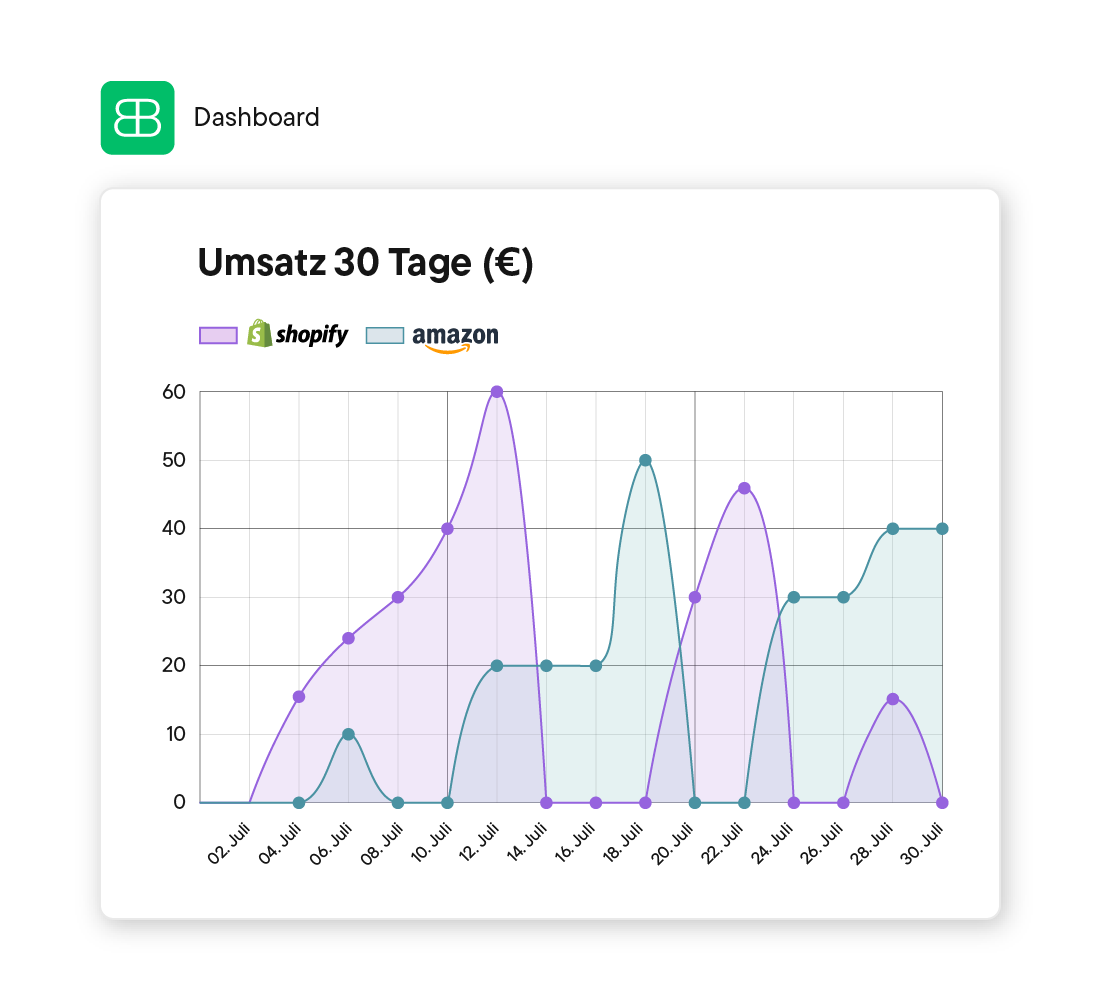
Identify your best sellers and slow movers. Optimize your inventory based on data and see instantly which products drive your business—and which ones are just tying up capital.
How fast are you really growing? Compare your monthly sales directly with previous years. Spot seasonal patterns and true growth at a glance.
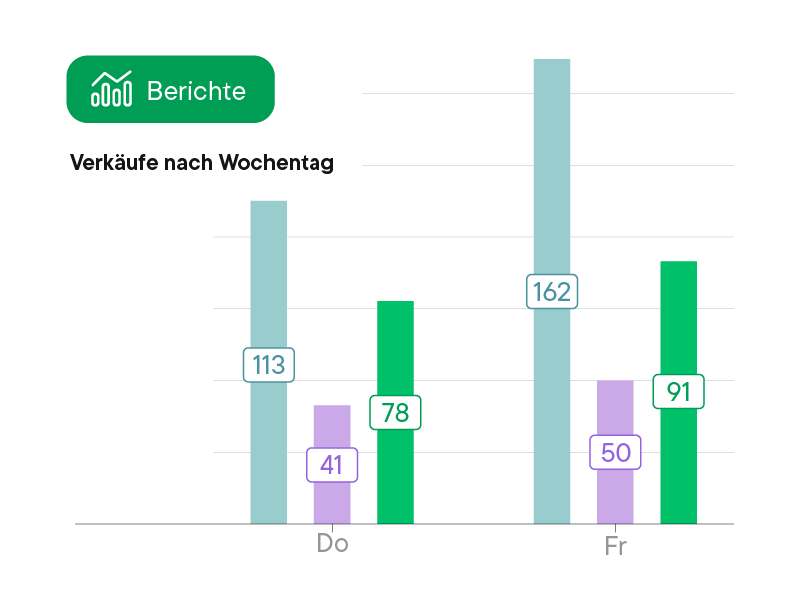
Find your highest-revenue time windows. Analyze which days of the week and what times of day you sell the most. Perfect for planning high-impact marketing campaigns.
Analyze Your Performance & Processes
Where is your effort paying off the most? Analyze which of your online stores and marketplaces generate the highest revenue to optimize your multichannel strategy based on data.
Measure and analyze packing speed per employee for maximum efficiency. Identify optimization potential at a glance and deploy your resources smarter.
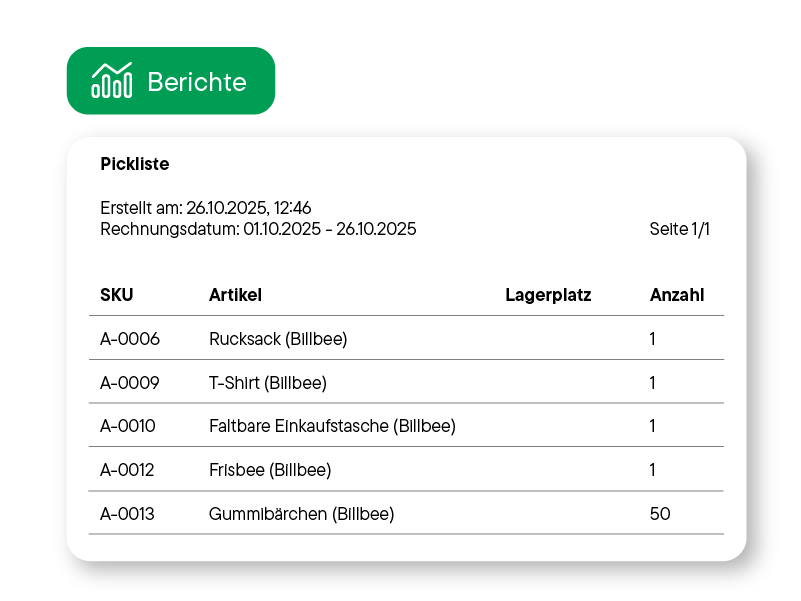
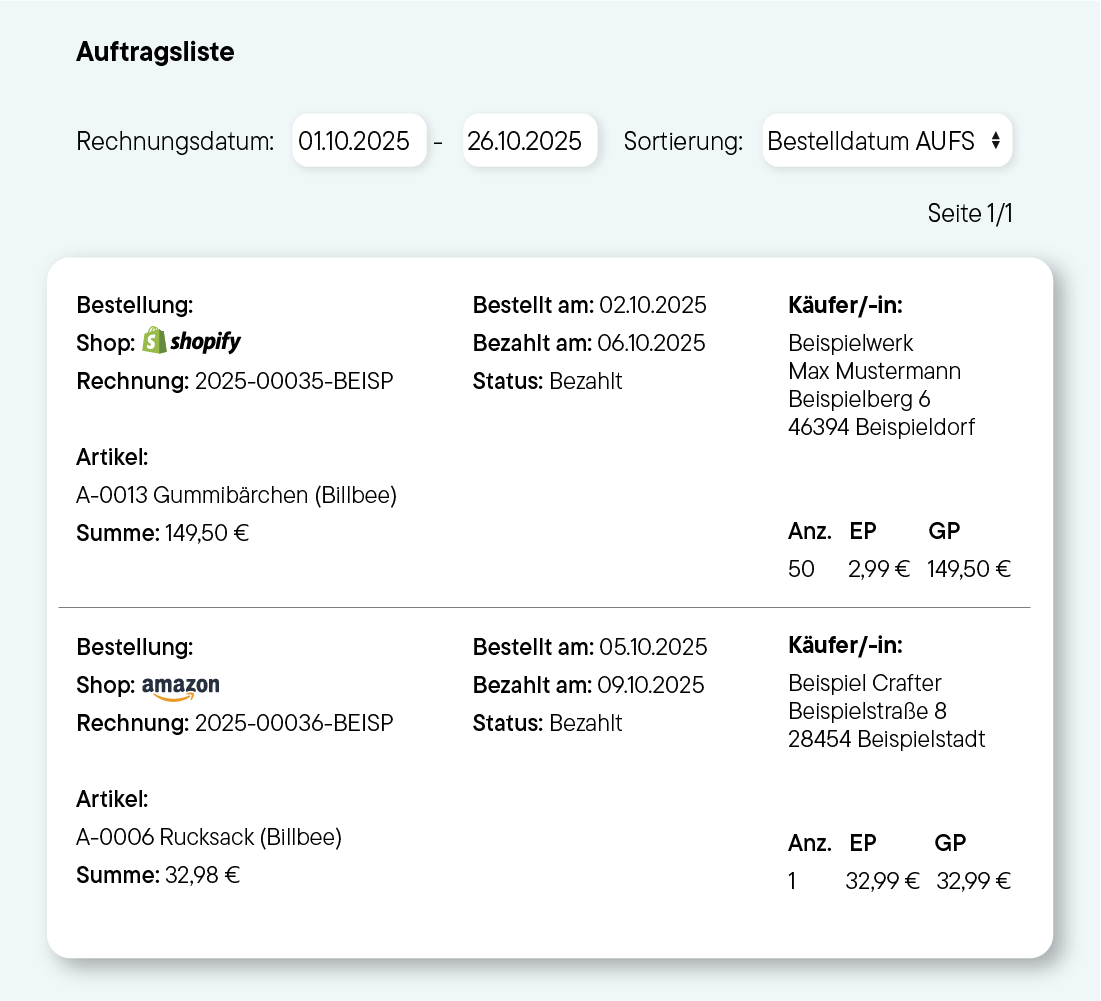
Use dynamic reports for active warehouse management. Generate filtered order lists for prioritization and optimized pick lists to massively accelerate your daily fulfillment.
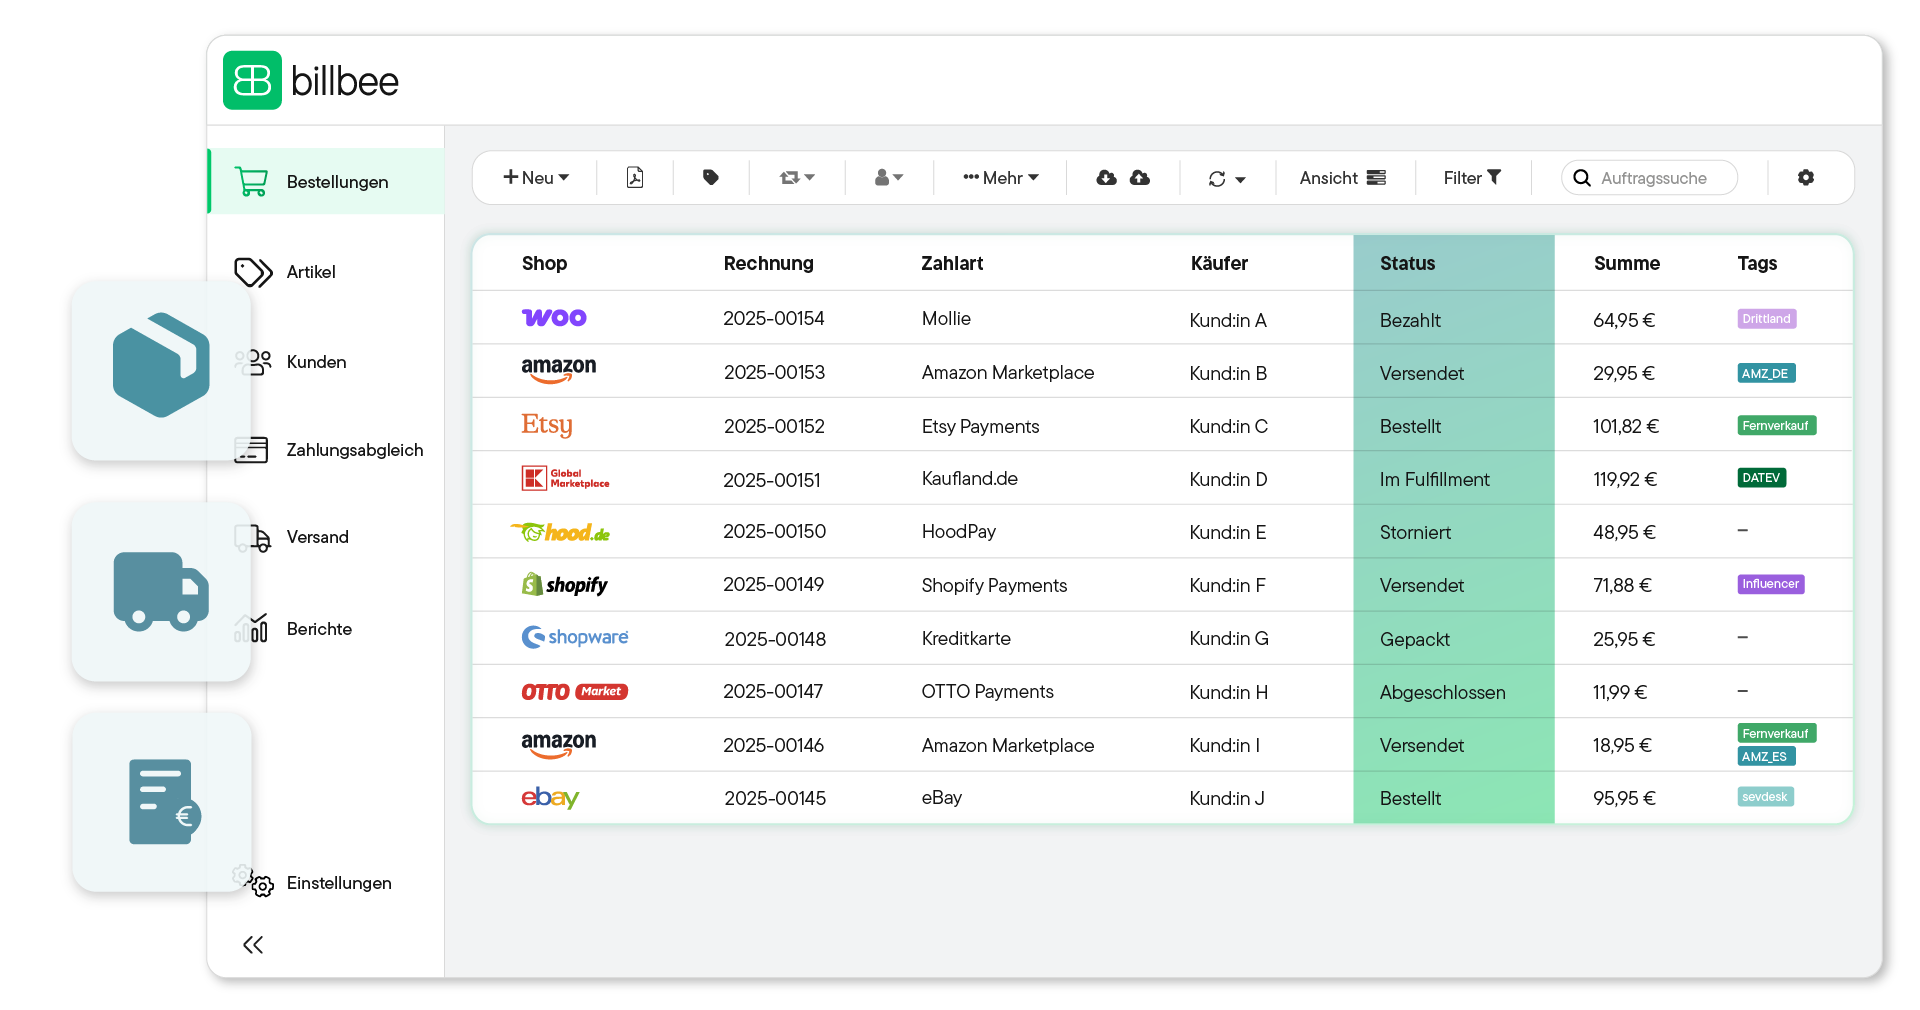
Setting Up Billbee Is a Breeze
You can get started with Billbee today, even without technical know-how. Our tutorials, extensive documentation, and more will help you with the setup.
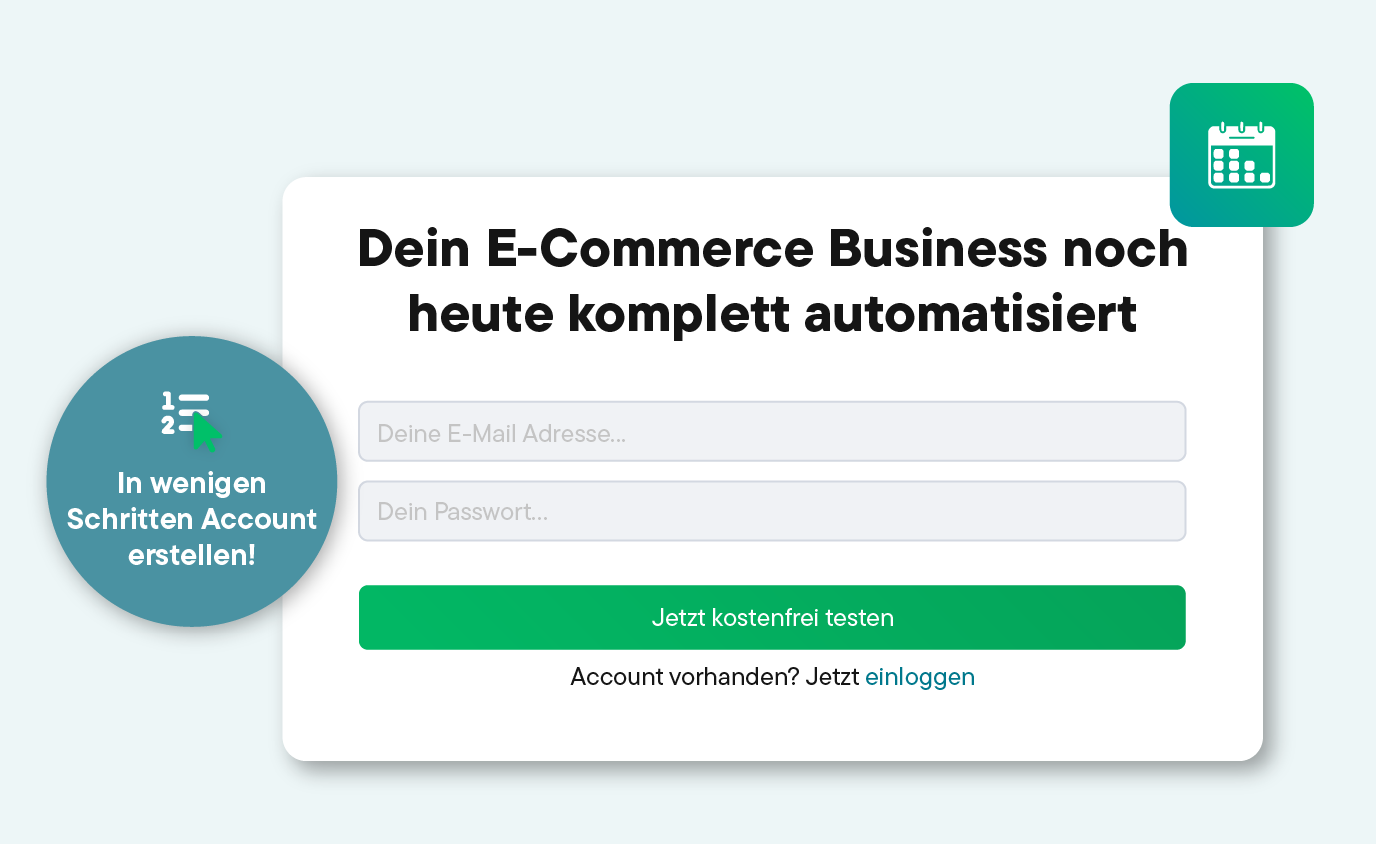
Register for your Billbee account and start your trial without entering payment details. The trial ends automatically without you having to cancel!
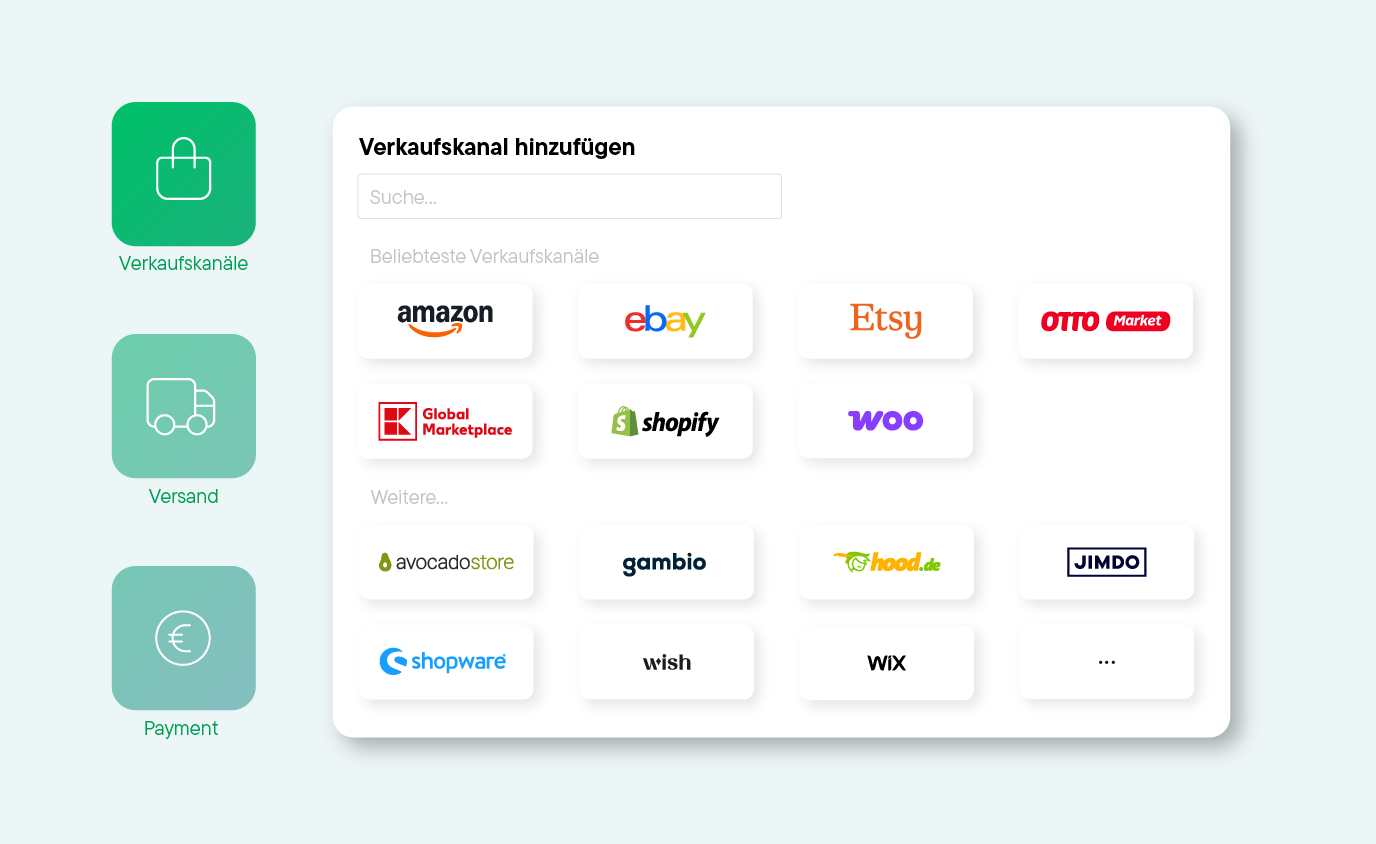
Connect your online stores, marketplaces, shipping carriers, and other tools to Billbee, and start importing your orders.
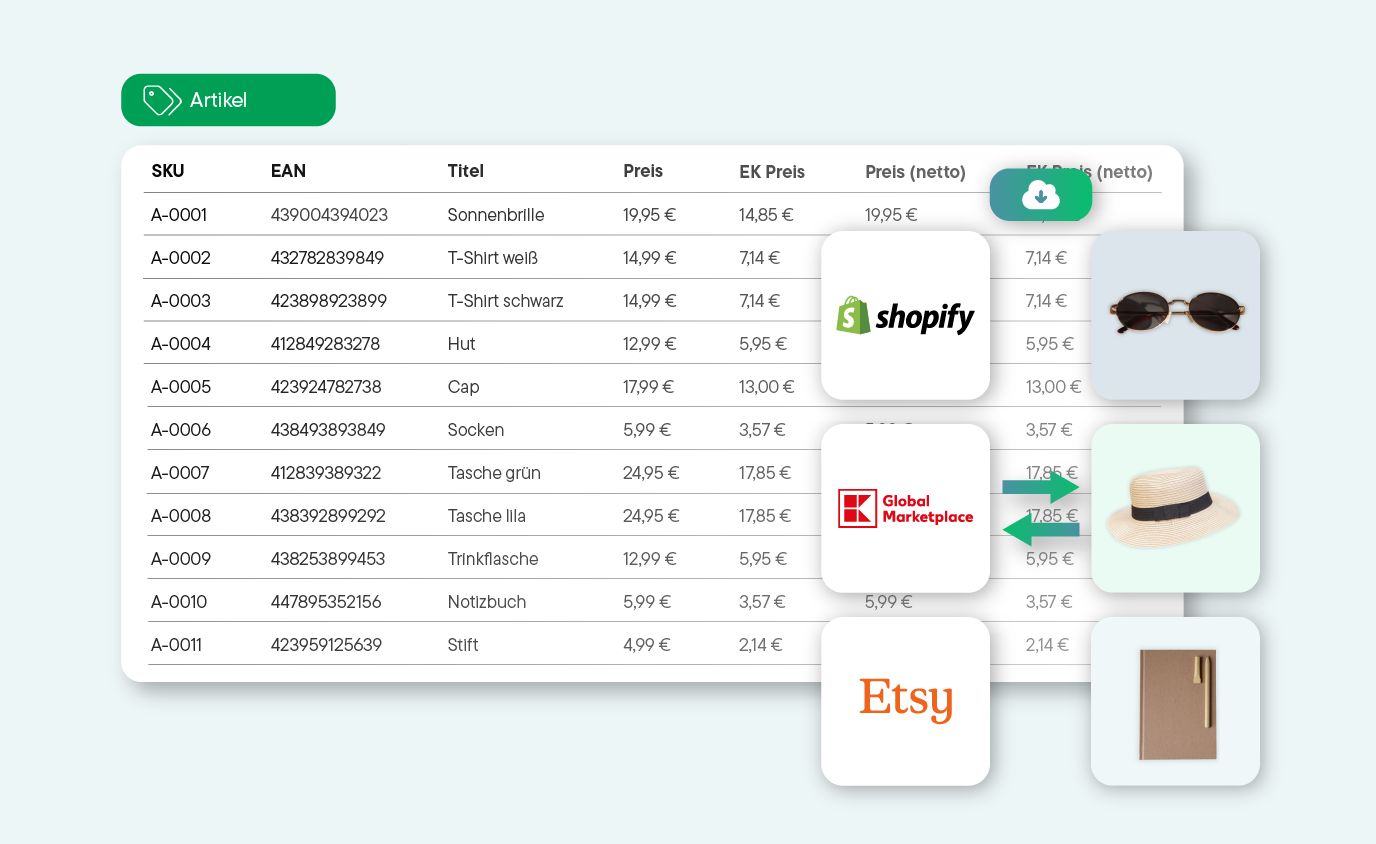
Whether manual or automated: Start managing your products and processing orders right away. See for yourself how much time you can save with Billbee!
Discover Our Network of Certified Partners!
We offer a broad network of certified, independent partners to help set up and optimize your Billbee account.
Find a Setup Partner
Sales and Order Reports
As an online seller, it is essential to know how many sales you've generated and when they occurred to draw the right conclusions for your next steps. Billbee’s reporting provides the perfect foundation for these insights.
Statistics for Your E-Commerce Performance
Which products are performing best? Which are lagging behind? On which days do I achieve the highest revenue? At what times? How is revenue developing across individual sales channels?
Billbee answers these and other questions with revenue statistics provided in both graphical and tabular formats. If you need more depth, you can simply use one of the numerous data exports to process your numbers further.
Order Lists & Pick Lists – Reports That Simplify Your Daily Routine
Keep track of open orders and the resulting to-dos. The "Order List" report shows you which orders still need to be processed. The "Pick List" report tells you exactly which items and quantities you need to pull from the warehouse for your current orders.
The Following Report Types Are Available in Billbee:
- Order List: Displays all pending orders. Use various filters to define exactly which orders and fields should be shown.
- Pick List: A comprehensive list of all products and quantities needed to pack current orders.
- Revenue by Product: Group and evaluate sales within a selected period per item.
- Year-Over-Year Monthly Sales: Compare sales from a selected period by month against previous years in both charts and tables.
- Daily Sales: Group sales for a selected period by day, presented as a chart.
- Sales by Weekday: Group sales within a selected period by the day of the week.
- Sales by Time of Day: Group sales for a selected period by the hour of sale.
- Sales by Weekday and Time: Group sales within a selected period by both weekday and hour.
- Average Daily Sales per Month: View average revenue and average order volume per day, grouped by month, as a chart.
- Packing Performance: An evaluation showing the number and total value of orders packed per employee per day.