

Reports & reports on orders and sales
As an online retailer, it is essential to know how many sales you generated and also when these sales took place in order to draw conclusions for further action. Billbee's reports provide the perfect basis for exactly this.
Statistics about your e-commerce performance
Which products run best? Which is the worst? On which days of the week do I achieve the highest sales? At what time? How are sales developing in the individual sales channels?
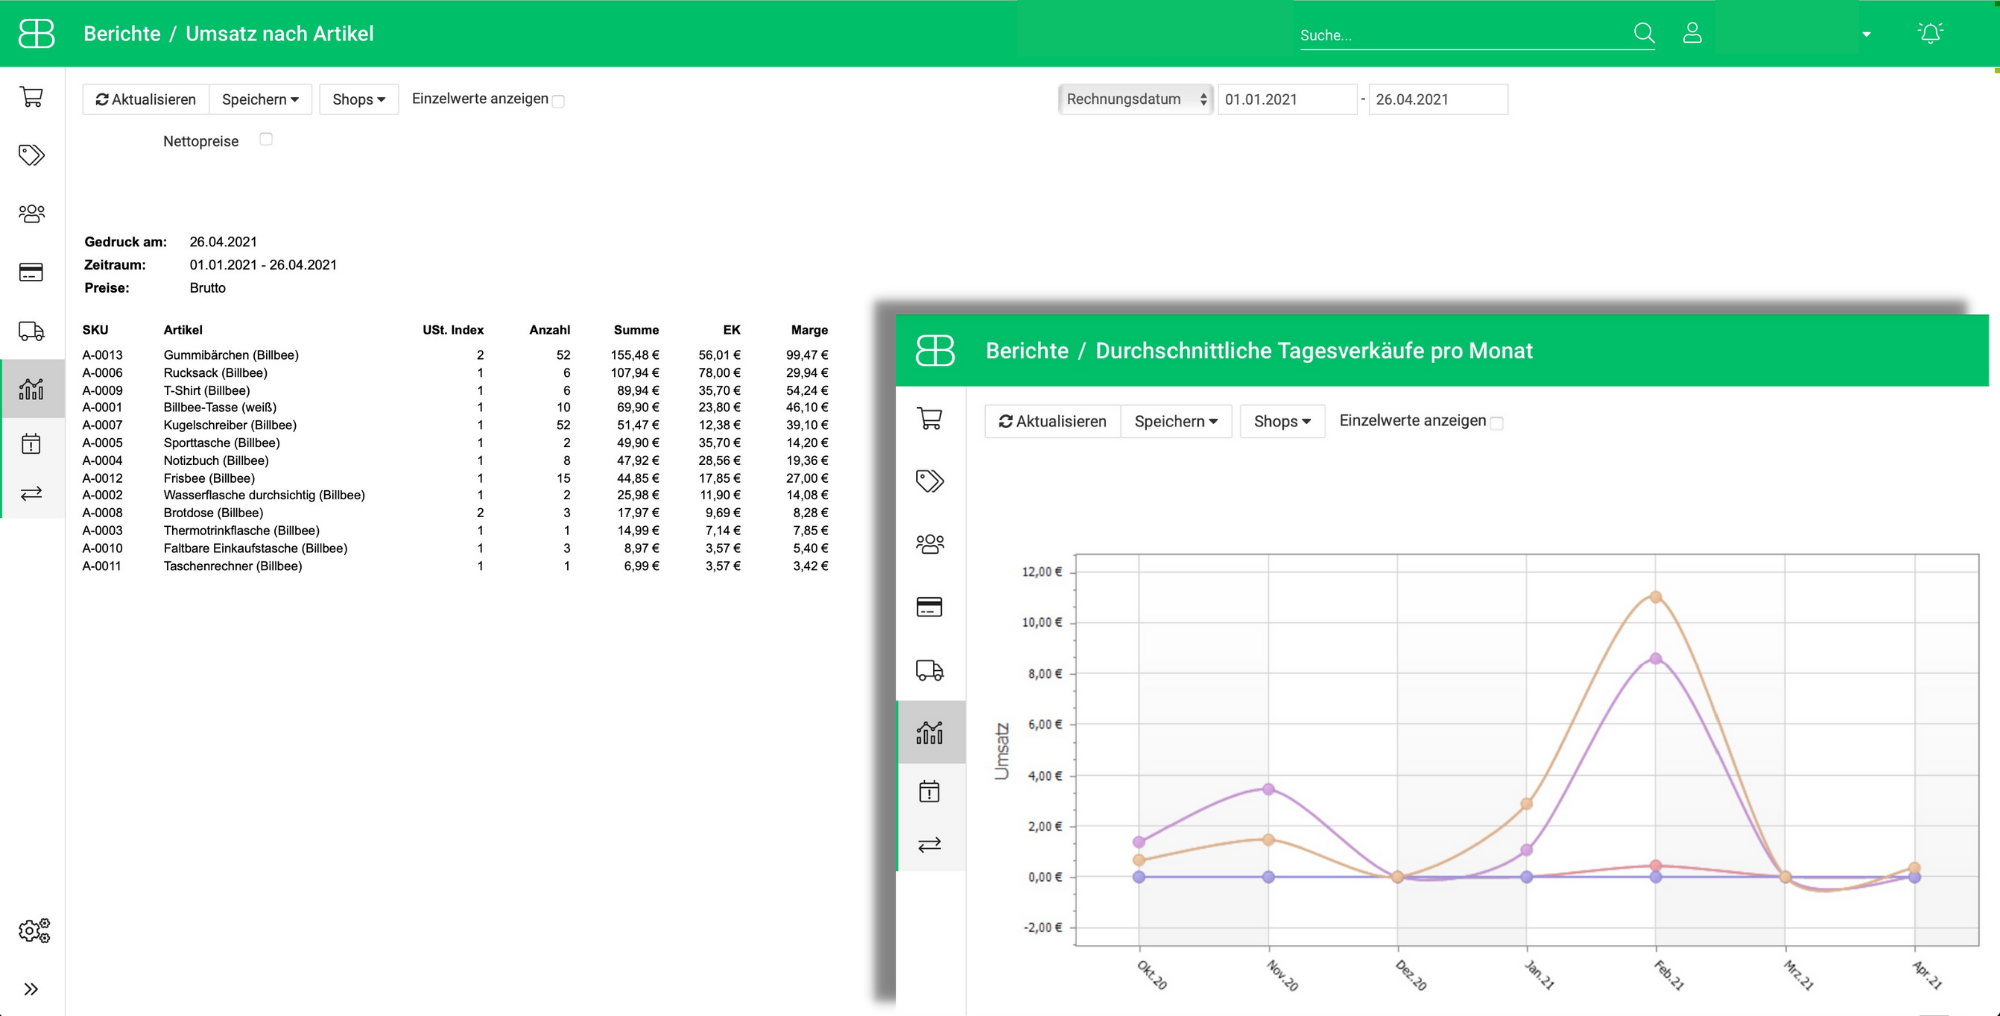
Billbee will answer these and other questions with some sales statistics both graphically and in tabular form. If that's not enough, you can simply use one of the numerous data exports and further process your figures.
Order list & pick list — reports that make your everyday work easier
Always keep an eye on open orders and the resulting to-do's. The “Order List” report shows you which orders still need to be completed. From the “Picklist” report, you can then see directly which articles you still need to fetch from the warehouse in which quantities for the current orders.

The following types of reports are available in Billbee:
- Order list: The order list shows you all orders that still need to be completed. Using various filters, you can determine exactly which orders should be displayed with which fields.
- Pick list: The pick list contains a list of all items with quantities that are required to pack current orders.
- Sales by item: Sales within a selectable period are grouped and evaluated for each item.
- Sales per month year over year: Sales in a selectable period are grouped per month and compared with previous years as a graph and as a table.
- Sales per day: Sales within a selectable period are grouped per day and displayed as a graph.
- Sales by weekday: Sales within a selectable period are grouped by day of the week.
- Sales by time: Sales within a selectable period are grouped by sales time (hour).
- Sales by day of the week and time: Sales in a selectable period are grouped by weekday and sales time.
- Average daily sales per month: The average turnover and the average number of sales per day are displayed as a graph for a selectable period of time.
- Packing capacity: An evaluation that shows the number and sum of packed orders per employee and day.